Our World in Data
Research and data to make progress against the worlds largest problems
Research and data to make progress against the worlds largest problems

Database of crystal structures
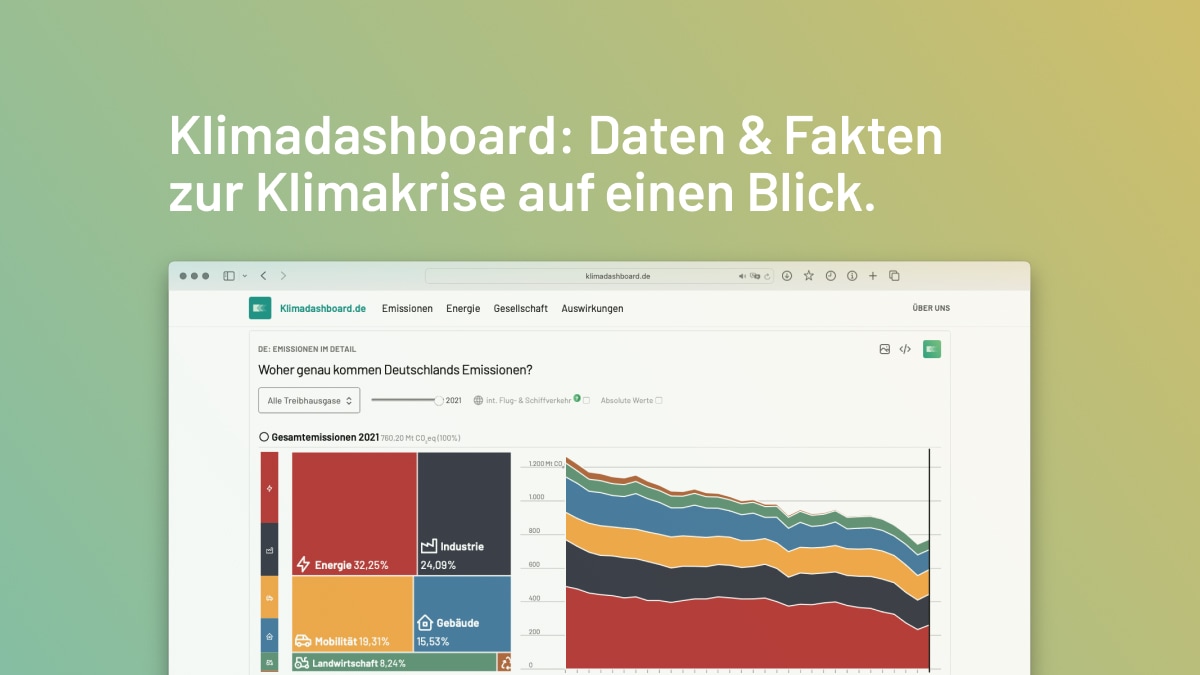
Interaktive Datenvisualisierungen zur Klimakrise in Deutschland. Nach wissenschaftlichen Standards und frei zugänglich für alle.
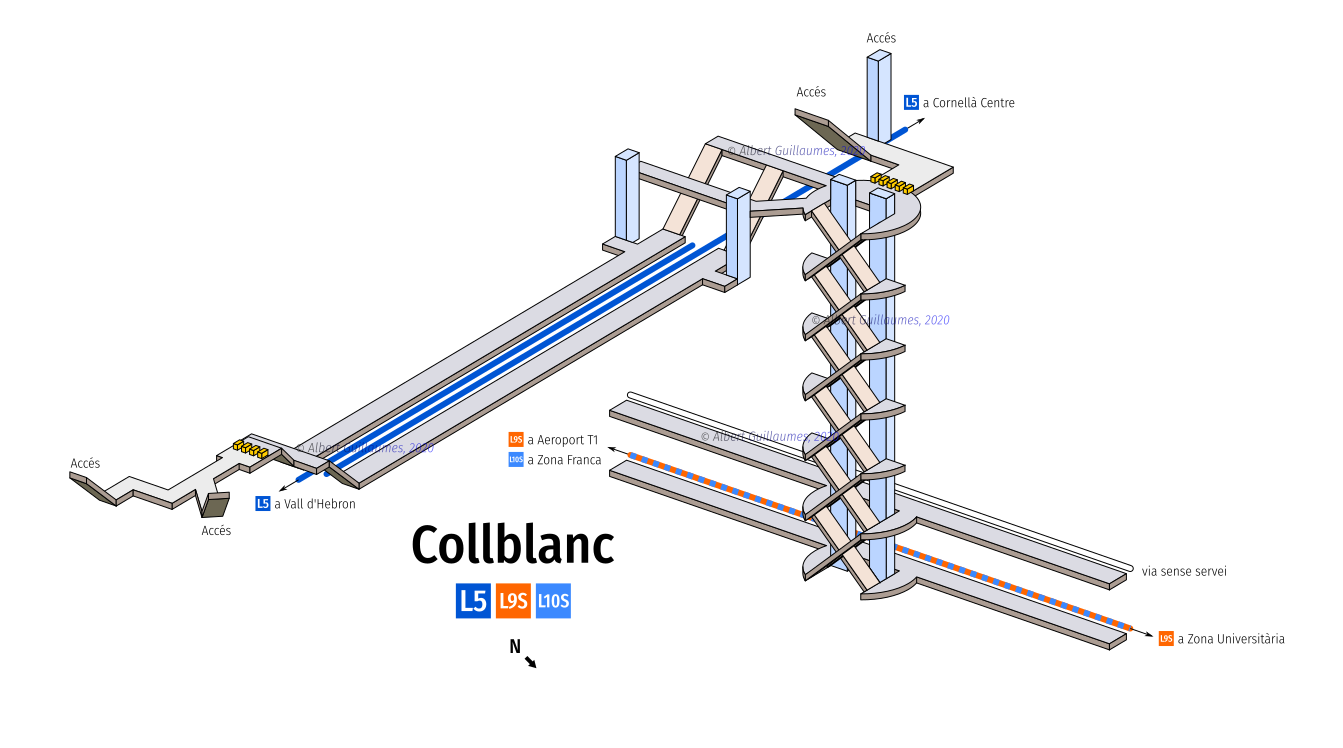
A gallery of drawings depicting the topology of metro stations from different European cities.
Dashboard Deutschland bietet interessante Informationen und spannende Einblicke für unterschiedliche Bereiche.

Distilling the world's data, information & knowledge into beautiful infographics & visualizations
Animated infographics about everything.