Datawrapper: Create charts, maps, and tables
Create interactive, responsive & beautiful data visualizations with the online tool Datawrapper â no code required.
Create interactive, responsive & beautiful data visualizations with the online tool Datawrapper â no code required.

Auto-Größenvergleich: Echtfahrzeuge maßstabsgetreu und direkt nebeneinander die Autoabmessungen von Tausenden aktueller und historischer Modelle aus derselben Perspektive vergleichen.
Games, visualizations, interactives and other weird stuff.
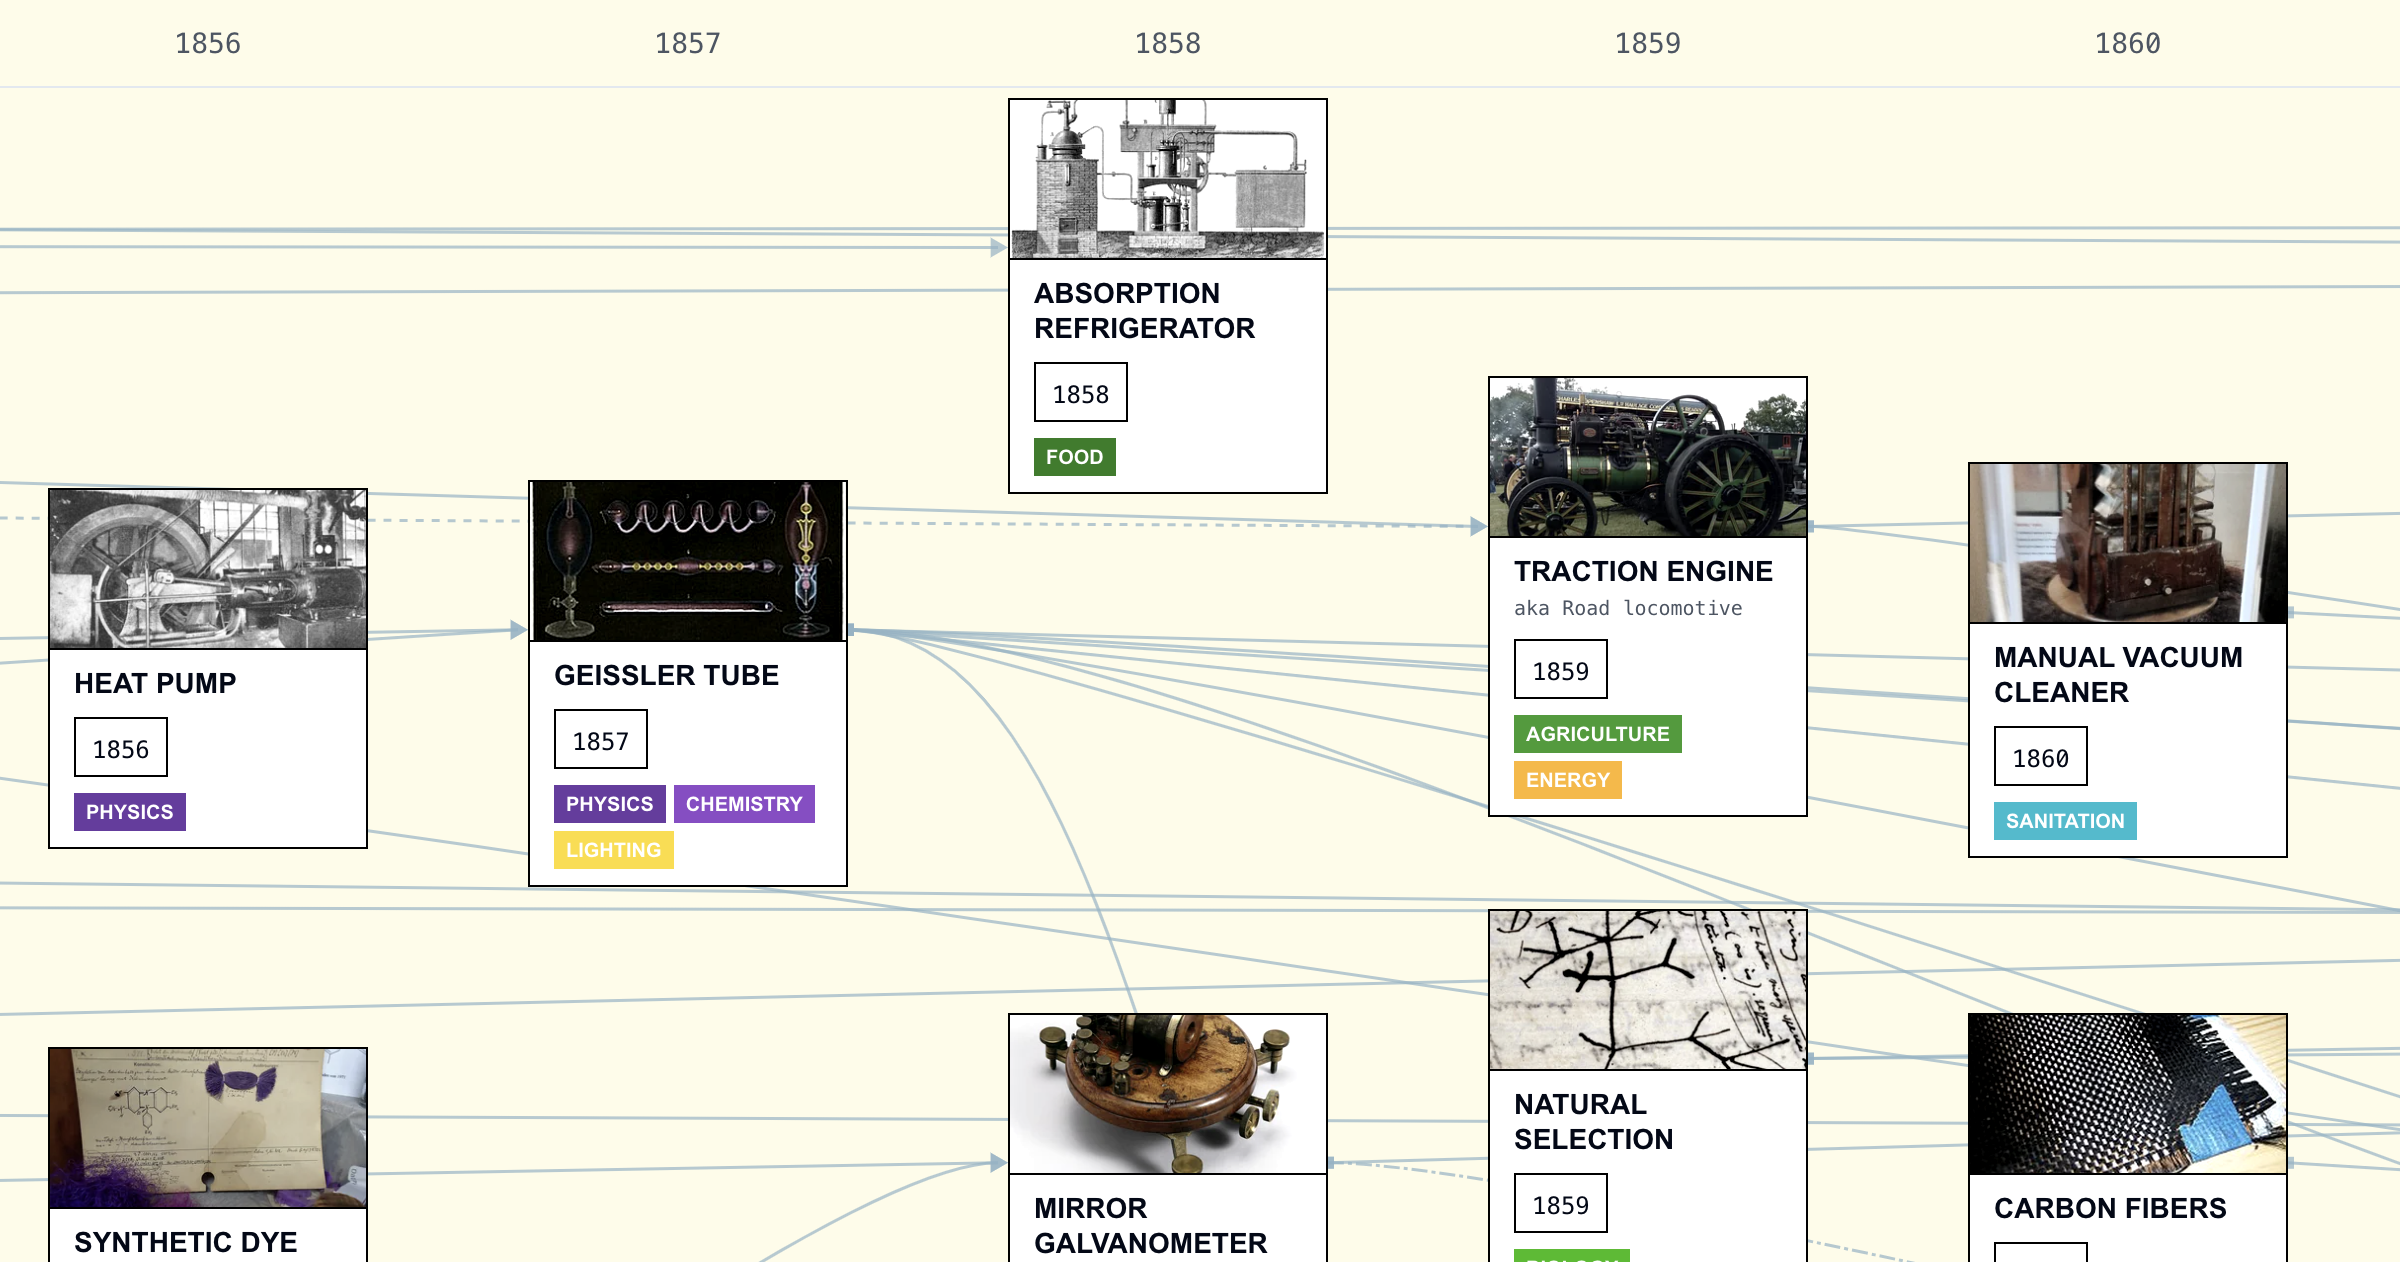
Interactive visualization of technological history
Apache ECharts, a powerful, interactive charting and visualization library for browser
Explore solar system in your browser
The C4 model for visualising software architecture

Research and data to make progress against the worlds largest problems
Learn and Test DMARC

Track the Starlink satellite constellation in real-time.
Database Subsetting and Relational Data Browsing Tool.

VisuAlgo was conceptualised in 2011 by Dr Steven Halim as a tool to help his students better understand data structures and algorithms