Datawrapper: Create charts, maps, and tables
Create interactive, responsive & beautiful data visualizations with the online tool Datawrapper â no code required.
Create interactive, responsive & beautiful data visualizations with the online tool Datawrapper â no code required.

SMARD - Strom- und Gasmarktdaten
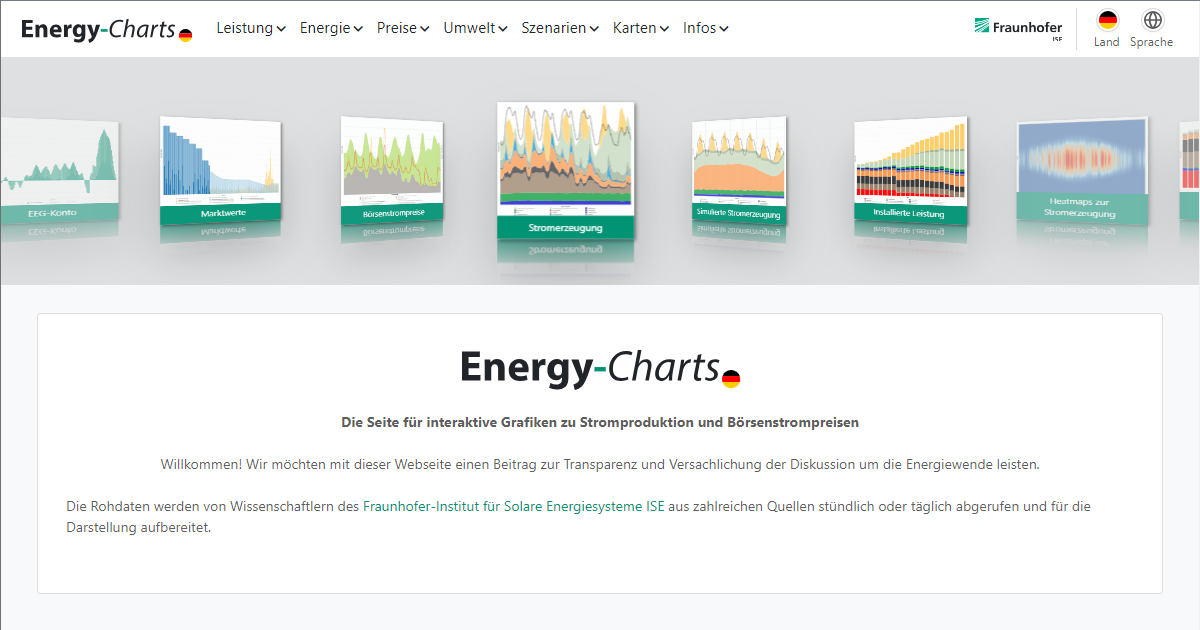
Die Energy-Charts bieten interaktive Grafiken zu: Stromproduktion, Stromerzeugung, Emissionen, Klimadaten, Spotmarktpreisen, Szenarien zur Energiewende und eine umfangreiche Kartenanwendung zu: Kraftwerken, Übertragungsleitungen und Meteodaten
Apache ECharts, a powerful, interactive charting and visualization library for browser
A web-based ASCII and Unicode diagram builder written in vanilla Javascript - casparwylie/cascii-core
The site for interactive graphics displaying energy production and spot market prices
Create interactive, responsive & beautiful data visualizations with the online tool Datawrapper — no code required.
Diagram Software and Flowchart Maker
Create fully customizable interactive and animated bar charts, time series and scatter plots.

An open-source tool for generating flowcharts from text
List of text to diagram tools